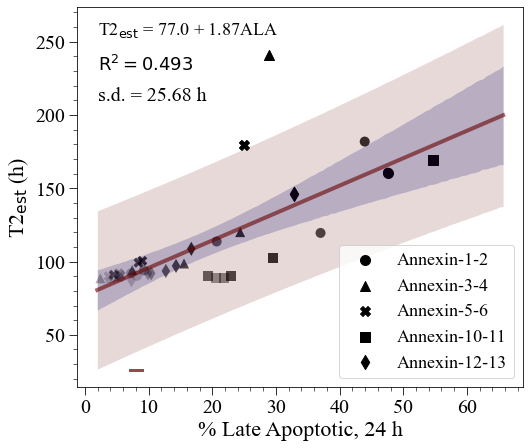
Annexin Late Apoptotic-vs-T2
Regression analysis of Annexin % Late Apoptotic cells and proliferation inflection points.
import numpy as np
import scipy.optimize as optim
import math
import os,sys
import pandas as pd
import copy
import matplotlib.pyplot as plt
from matplotlib import rcParams
import scipy.stats as st
from scipy.stats import t

from sklearn.metrics import auc
def linear(x,a,b):
    return (a + b*x)
data_folder = './data/Annexin'
os.chdir(data_folder)
Read Annexin data
v24 = pd.read_csv('all-Annexin24h-data.csv')

name_tag = {}

name_tag['AH'] = 'Healthy cells (%)'
name_tag['AEA'] = 'Early apoptotic cells (%)'
name_tag['ALA'] = 'Late apoptotic cells (%)'
name_tag['AN'] = 'Necrotic cells (%)'

experiment_name = v24['Experiment name'].dropna().to_list()
weight1 = pd.Series([0.2, 0.3, 0.4, 0.6, 0.7, 0.8, 0.9])
colors1 = weight1.apply(lambda x: (0,0,0,x)).tolist()
all_data = {}

for n in list(v24):
    all_data[n] = v24[n].to_numpy()

all_data['T2'] = 85.77*np.power(all_data['AODAPI']/100,-1.7)
tag = 'ALA'

result = st.linregress(all_data[tag],all_data['T2'],alternative='two-sided')

r_text = r'$\mathrm{R}^2 = ' + str(round(result.rvalue**2,3)) + '$'
results = optim.curve_fit(linear,all_data[tag],all_data['T2'],absolute_sigma=False,full_output=True)

popt, pcov = results[0], results[1]

p_std = np.sqrt(np.diag(pcov))

fitname = r'T2$_{\mathrm{est}}$ = ' + str(round(popt[0],2)) + ' + ' + str(round(abs(popt[1]),2)) + tag
dof = len(all_data['T2']) - 2

tinv = lambda p, df: abs(t.ppf(p/2,df))
ts = tinv(0.05,dof)

s_err = ts*result.stderr
i_err = ts*result.intercept_stderr
residual = linear(all_data[tag],popt[0],popt[1]) - all_data['T2']
norm_RSS = math.sqrt(np.dot(residual,residual)/(len(all_data['T2'])-2))
RSS_text = r's.d. = ' + str(round(norm_RSS,2)) + ' h'
d = all_data[tag]
mean_x = np.linspace(0.8*np.min(d),1.2*np.max(d),100)
mean_t2 = linear(mean_x,popt[0],popt[1])
Compute confidence interval and prediction bound.
n_samples = 10000

s_is, i_is = [], []

cit2_up = np.zeros(shape=mean_x.shape)
cit2_low = np.zeros(shape=mean_x.shape)

pbt2_up = np.zeros(shape=mean_x.shape)
pbt2_low = np.zeros(shape=mean_x.shape)

sigmat2_up = np.zeros(shape=mean_x.shape)
sigmat2_low = np.zeros(shape=mean_x.shape)

t2 = np.zeros(shape=mean_x.shape)
effective_sigma = np.zeros(shape=mean_x.shape)

for i in range(0,mean_x.shape[0]):
    samples = []

    a_samples, b_samples = np.random.multivariate_normal(popt,pcov,n_samples).T

    for a_sample,b_sample in zip(a_samples,b_samples):
        samples.append(linear(mean_x[i],a_sample,b_sample))

    t2[i] = linear(mean_x[i],popt[0],popt[1])

    sigma = np.std(samples)

    effective_sigma[i] = math.sqrt(sigma**2 + norm_RSS**2)

    ci95 = effective_sigma[i]*ts

    pbt2_low[i], pbt2_up[i] = mean_t2[i] - ci95, mean_t2[i] + ci95

    cit2_low[i], cit2_up[i] = mean_t2[i] - sigma*ts, mean_t2[i] + sigma*ts

    sigmat2_low[i], sigmat2_up[i] = mean_t2[i] - effective_sigma[i], mean_t2[i] + effective_sigma[i]
# Number of points in each set
n = 7
fig, axs = plt.subplots(figsize=(8,7))

rcParams['font.family'] = 'sans-serif'
rcParams['font.sans-serif'] = ['Times New Roman']

plt.scatter(all_data[tag][:n],all_data['T2'][:n],marker='o',linewidth=0,s=100,c=colors1)
plt.scatter(all_data[tag][n:2*n],all_data['T2'][n:2*n],marker='^',linewidth=0,s=100,c=colors1)
plt.scatter(all_data[tag][2*n:3*n],all_data['T2'][2*n:3*n],marker='X',linewidth=0,s=100,c=colors1)
plt.scatter(all_data[tag][3*n:4*n],all_data['T2'][3*n:4*n],marker='s',linewidth=0,s=100,c=colors1)
plt.scatter(all_data[tag][4*n:],all_data['T2'][4*n:],marker='d',linewidth=0,s=100,c=colors1)

plt.scatter(all_data[tag][n-1],all_data['T2'][n-1],marker='o',s=100,c='black',label=experiment_name[0])
plt.scatter(all_data[tag][2*n-1],all_data['T2'][2*n-1],marker='^',s=100,c='black',label=experiment_name[1])
plt.scatter(all_data[tag][3*n-1],all_data['T2'][3*n-1],marker='X',s=100,c='black',label=experiment_name[2])
plt.scatter(all_data[tag][4*n-1],all_data['T2'][4*n-1],marker='s',s=100,c='black',label=experiment_name[3])
plt.scatter(all_data[tag][-1],all_data['T2'][-1],marker='d',s=100,c='black',label=experiment_name[4])

plt.plot(mean_x,mean_t2,alpha=0.6,lw=4,color='#660000')
plt.fill_between(mean_x,pbt2_up,pbt2_low,alpha=0.15,color='#660000',linewidth=0.0)
plt.fill_between(mean_x,cit2_up,cit2_low,alpha=0.2,color='#000066',linewidth=0.0)

plt.xticks(size=20)
plt.yticks(size=20)
plt.xlabel('% Late Apoptotic, 24 h',size=22)
plt.ylabel(r'T2$_{\mathrm{est}}$ (h)',size=22,rotation=90)
plt.minorticks_on()
axs.tick_params(which='major', length=8)
axs.tick_params(which='minor', length=4)
plt.legend(frameon=True,prop={'size': 18},markerscale=1.0,handlelength=2.0,loc='lower right')
plt.text(2,230,r_text,fontsize=18)
plt.text(2,210,RSS_text,fontsize=20)

plt.plot(np.linspace(7,9,2),26*np.ones(2,),color='#660000',alpha=0.7,lw=3)
plt.text(2,255,fitname,fontsize=18)
Text(2, 255, 'T2$_{\mathrm{est}}$ = 77.0 + 1.87ALA')
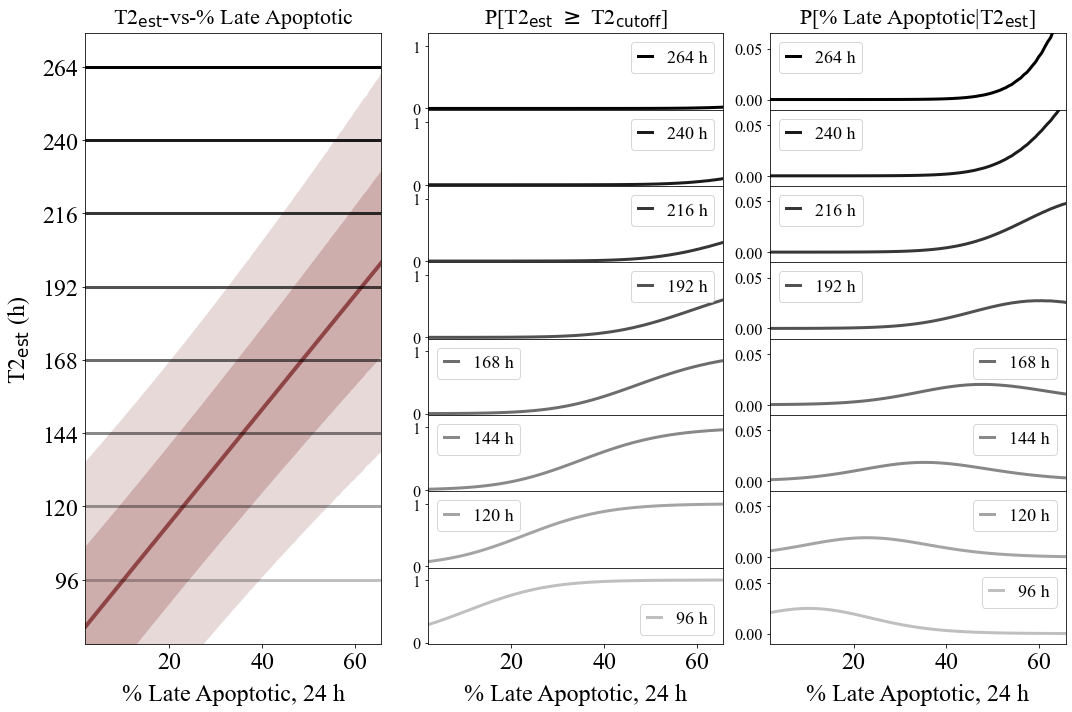
Compute survival function and conditional viability distribution.
#test_t2s = [96,108,120,132,144,156,168,180,192,204,216,228,240,252,264]
test_t2s = [96,120,144,168,192,216,240,264]
#test_t2s = [96,144,192,240]
test_t2s.reverse()

cutoff_probs = {}
pdfs = {}
cdfs = {}

for k in test_t2s:
    cutoff_probs[k] = np.zeros(shape=mean_x.shape)
    pdfs[k] = np.zeros(shape=mean_x.shape)

responses = np.zeros(shape=(len(test_t2s),mean_x.shape[0]))

j = 0

for k in test_t2s:
    for i in range(0,mean_x.shape[0]):
        cutoff_probs[k][i] = st.t.sf(k,df=dof,loc=t2[i],scale=effective_sigma[i])
        pdfs[k][i] = st.t.pdf(k,df=dof,loc=t2[i],scale=effective_sigma[i])

    pdfs[k] *= 1.0/np.sum(pdfs[k])

    x = copy.deepcopy(pdfs[k])#[::-1])
    cdfs[k] = np.round(np.array([np.sum(x[m:]) for m in range(0,pdfs[k].shape[0])] + [0]),3)

    responses[j,:] = pdfs[k]

    j += 1
fig = plt.figure(tight_layout=True,figsize=(15,10))
gs = fig.add_gridspec(len(test_t2s),3, hspace=0)

ax = fig.add_subplot(gs[:,0])
ax.plot(mean_x,t2,linewidth=4,color='#660000',alpha=0.6,label=fitname)
ax.fill_between(mean_x,pbt2_up,pbt2_low,alpha=0.15,color='#660000',linewidth=0.0)
ax.fill_between(mean_x,sigmat2_up,sigmat2_low,alpha=0.2,color='#660000',linewidth=0.0)

ax.set_title(r'T2$_{\mathrm{est}}$-vs-% Late Apoptotic',size=22,pad=10)

ax.tick_params(axis='both',labelsize=24)
ax.set_yticks(test_t2s)
ax.set_xlabel(r'% Late Apoptotic, 24 h',size=24,labelpad=10)
ax.set_ylabel(r'T2$_{\mathrm{est}}$ (h)',size=24,rotation=90,labelpad=10)
ax.set_ylim(75,275)
ax.set_xlim(np.min(mean_x),np.max(mean_x))

for t in test_t2s:
    _alpha = 0.25 + 0.75*(t - np.min(test_t2s))/(np.max(test_t2s) - np.min(test_t2s))

    ax.plot(mean_x,t*np.ones(shape=mean_x.shape[0]),color='black',lw=3,alpha=_alpha)

for k in range(len(test_t2s)):
    ax = fig.add_subplot(gs[k,1])

    _alpha = 0.25 + 0.75*(test_t2s[k] - np.min(test_t2s))/(np.max(test_t2s) - np.min(test_t2s))

    ax.plot(mean_x,cutoff_probs[test_t2s[k]],lw=3,color='black',label=str(test_t2s[k])+' h',alpha=_alpha)
    ax.tick_params(axis='y',labelsize=12)
    ax.set_ylim(-0.02,1.2)
    ax.set_xlim(np.min(mean_x),np.max(mean_x))
    ax.legend(frameon=True,prop={'size': 18,'family':'Times New Roman'},markerscale=1.0,handlelength=0.8,loc='best')

    ax.tick_params(axis='y',labelsize=16)

    if k==len(test_t2s)-1:
        ax.tick_params(axis='x',labelsize=24)
    else:
        ax.tick_params(axis='x',labelsize=0)

    if k==0:
        ax.set_title(r'P[T2$_{\mathrm{est}}$ $\geq$ T2$_{\mathrm{cutoff}}$]',size=22,pad=10)

ax.set_xlabel(r'% Late Apoptotic, 24 h',size=24,labelpad=10)

for k in range(len(test_t2s)):
    ax = fig.add_subplot(gs[k,2])

    _alpha = 0.25 + 0.75*(test_t2s[k] - np.min(test_t2s))/(np.max(test_t2s) - np.min(test_t2s))

    ax.plot(mean_x,pdfs[test_t2s[k]],lw=3,color='black',label=str(test_t2s[k])+' h',alpha=_alpha)
    ax.tick_params(axis='y',labelsize=12)
    ax.set_xlim(np.min(mean_x),np.max(mean_x))
    ax.legend(frameon=True,prop={'size': 18,'family':'Times New Roman'},markerscale=1.0,handlelength=0.8,loc='best')

    ax.set_ylim(-0.01,0.065)

    ax.tick_params(axis='y',labelsize=16)

    if k==len(test_t2s)-1:
        ax.tick_params(axis='x',labelsize=24)
    else:
        ax.tick_params(axis='x',labelsize=0)

    if k==0:
        ax.set_title('P[% Late Apoptotic|T2$_{\mathrm{est}}$]',size=22,pad=10)

ax.set_xlabel(r'% Late Apoptotic, 24 h',size=24,labelpad=10)
Text(0.5, 0, '% Late Apoptotic, 24 h')
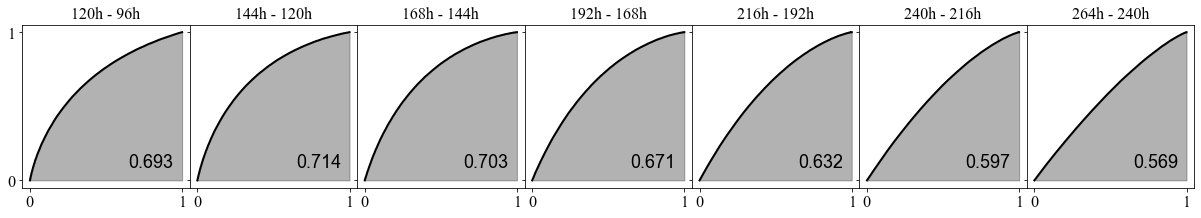
Compute AUC values.
wd = 3

l = int((len(test_t2s)-1)*wd)

fig = plt.figure(figsize=(l,wd))
gs = fig.add_gridspec(ncols=len(test_t2s)-1, nrows=1, wspace=0)

axs = gs.subplots(sharex=True,sharey=True)

all_aucs = []

test_t2s = test_t2s[::-1]

wf = open('auc_summary.csv','w')
print('Time interval,AUC',file=wf)

for k in range(0,len(test_t2s)-1):
    dx = copy.deepcopy(cdfs[test_t2s[k]][::-1])
    dy = copy.deepcopy(cdfs[test_t2s[k+1]][::-1])

    all_aucs.append(auc(dx,dy))

    label_text = str(round(all_aucs[-1],3))

    axs[k].plot(dx,dy,lw=2,color='black',label=label_text)
    axs[k].fill_between(dx,0,dy,color='black',alpha=0.3)#,label=str(test_t2s[k])+' h',alpha=_alpha)
    axs[k].set_xticks((0,1))
    axs[k].set_yticks((0,1))
    axs[k].tick_params(axis='both',labelsize=16)
    axs[k].legend(frameon=False,prop={'size': 18,'family':'Arial'},markerscale=1.0,handlelength=0.0,loc='lower right')
    axs[k].set_title(str(test_t2s[k+1])+'h - '+str(test_t2s[k])+'h',fontsize=16)

    output_string = str(test_t2s[k])+'h - '+str(test_t2s[k+1])+'h'
    output_string += ',' + label_text

    print(output_string,file=wf)

wf.close()